Klaude Console Features
This guide covers the main features of the KubeStellar Klaude Console.
Dashboard
The main dashboard provides a customizable view of your multi-cluster environment.
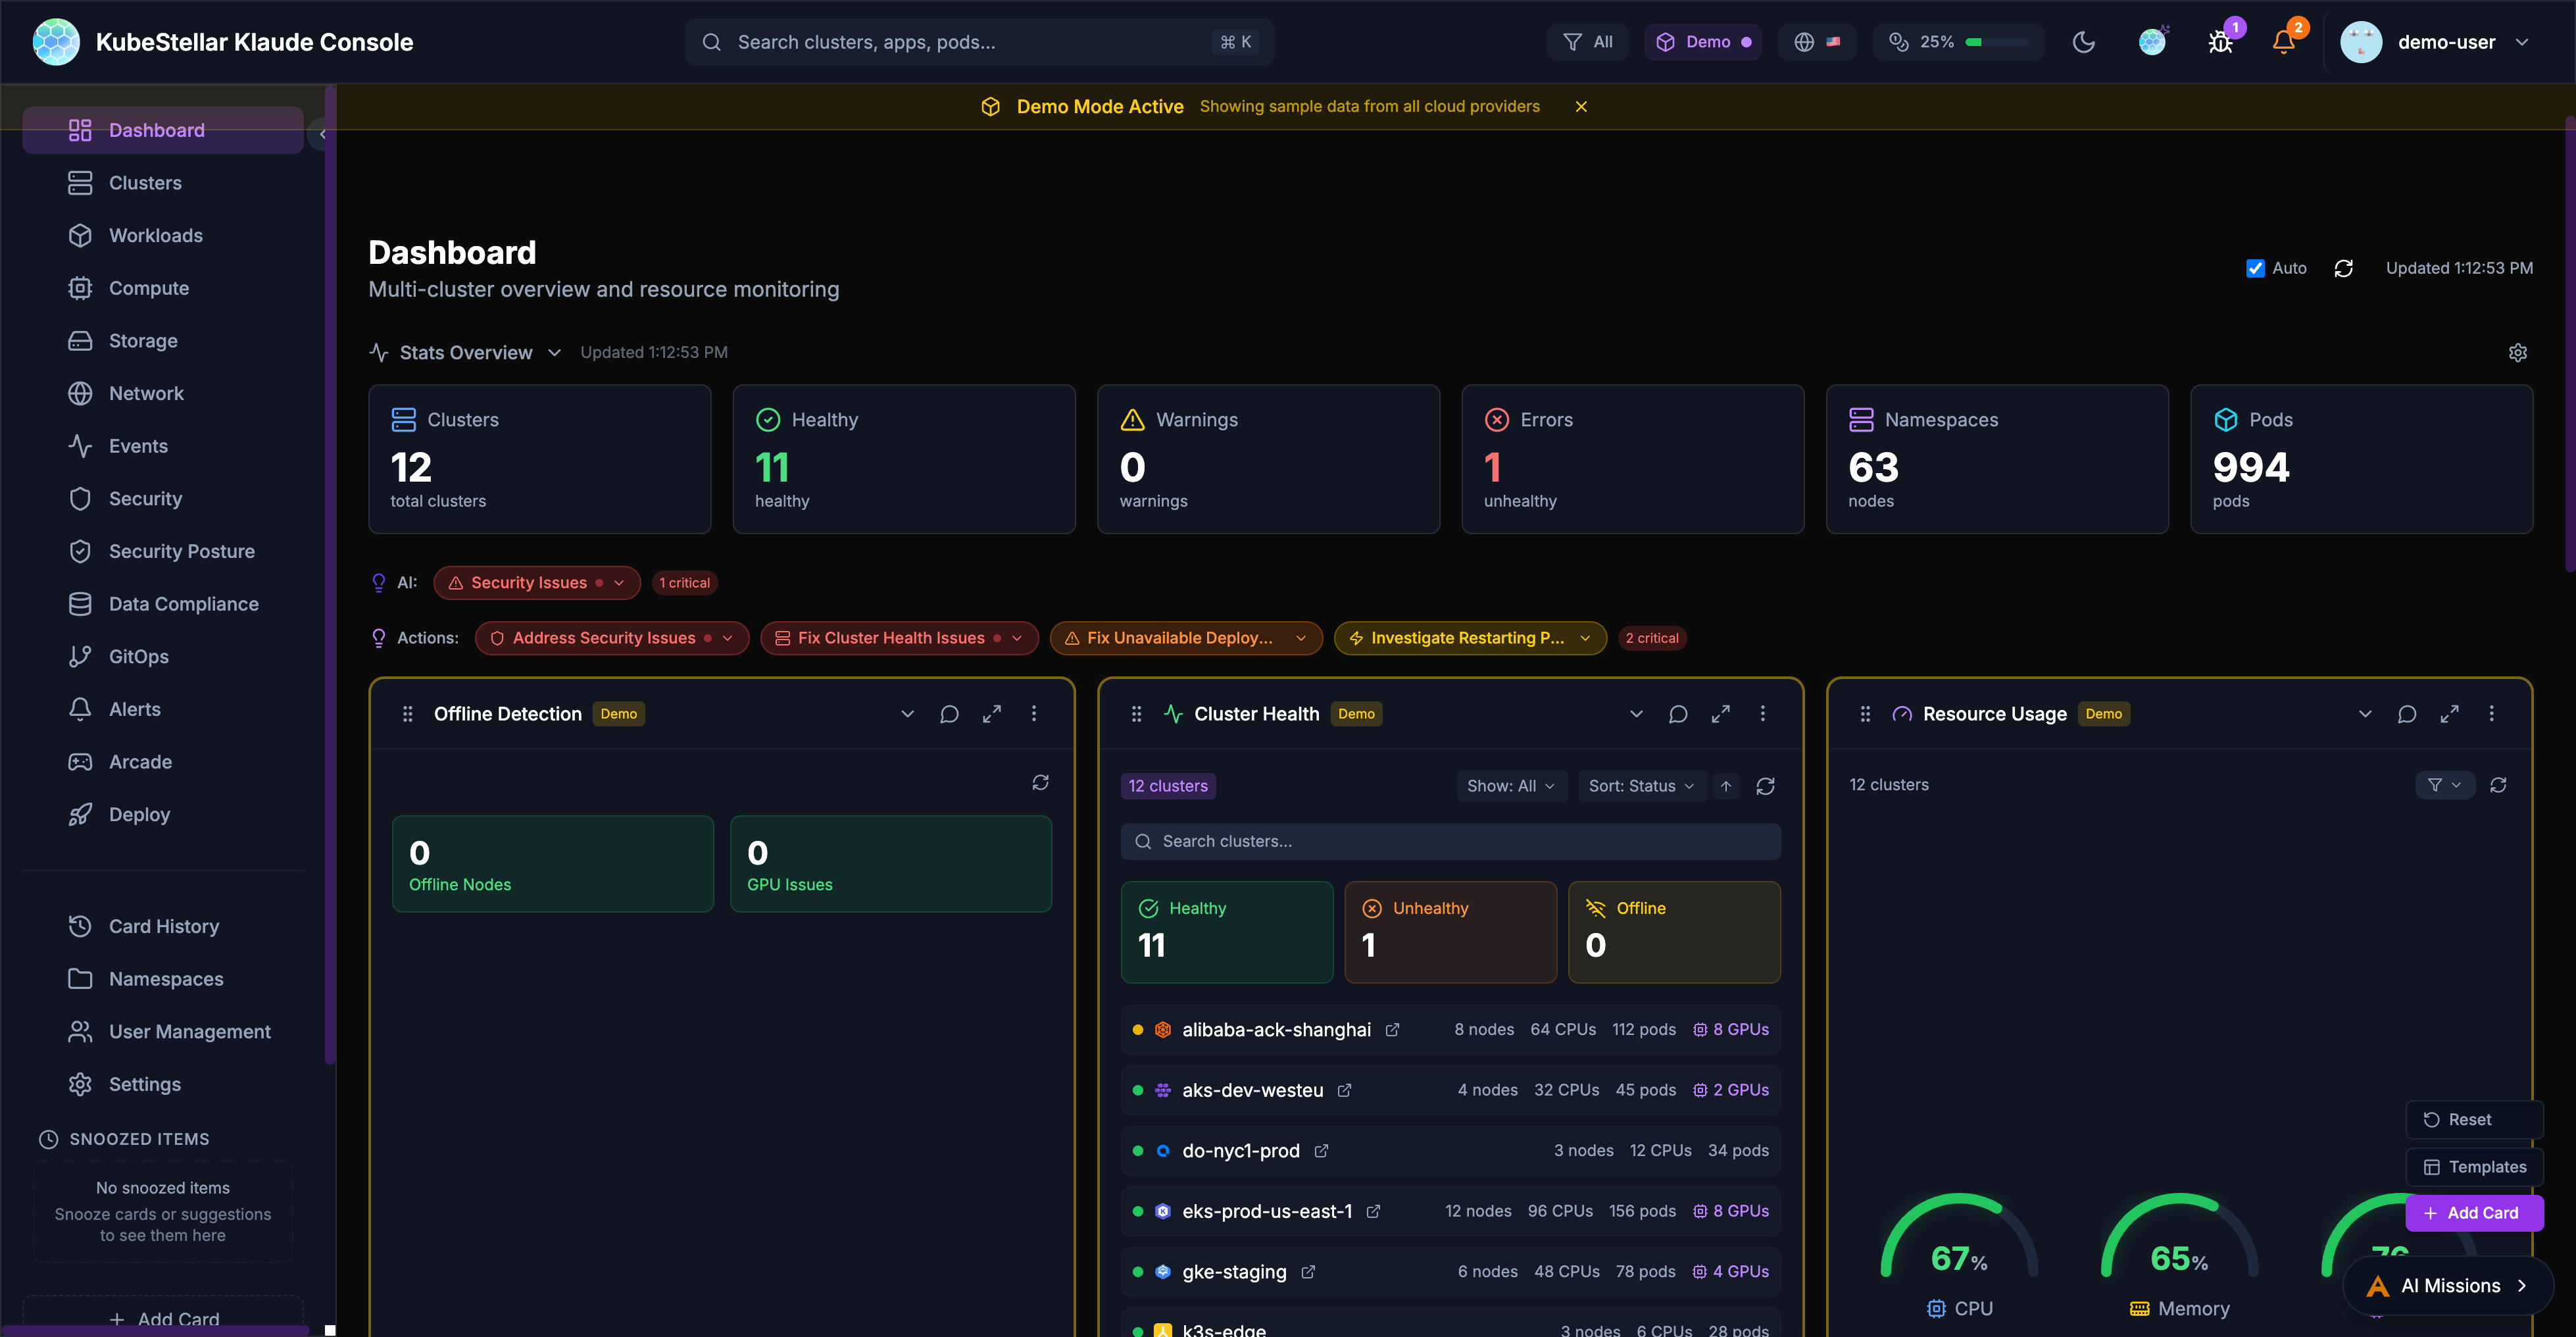
Stats Overview
The stats bar at the top of the dashboard displays key metrics:
- Clusters: Total cluster count and health status
- Nodes: Total nodes across all clusters
- Pods: Total pod count with status breakdown
- AI Insights: Security issues and recommended actions
Dashboard Cards
Cards are the building blocks of the dashboard. Each card displays specific information about your clusters:
- Drag cards to reorder them
- Resize cards by adjusting their width
- Collapse cards to save space
- Use the AI button to get insights about card data
Dashboard Templates
Pre-configured dashboard layouts for common use cases:
- Operations: Cluster health, deployments, events
- GPU Monitoring: GPU utilization, workloads, trends
- Security: OPA policies, alerts, vulnerabilities
- GitOps: Helm releases, drift detection, sync status
Settings
The settings page allows you to configure all aspects of the console.
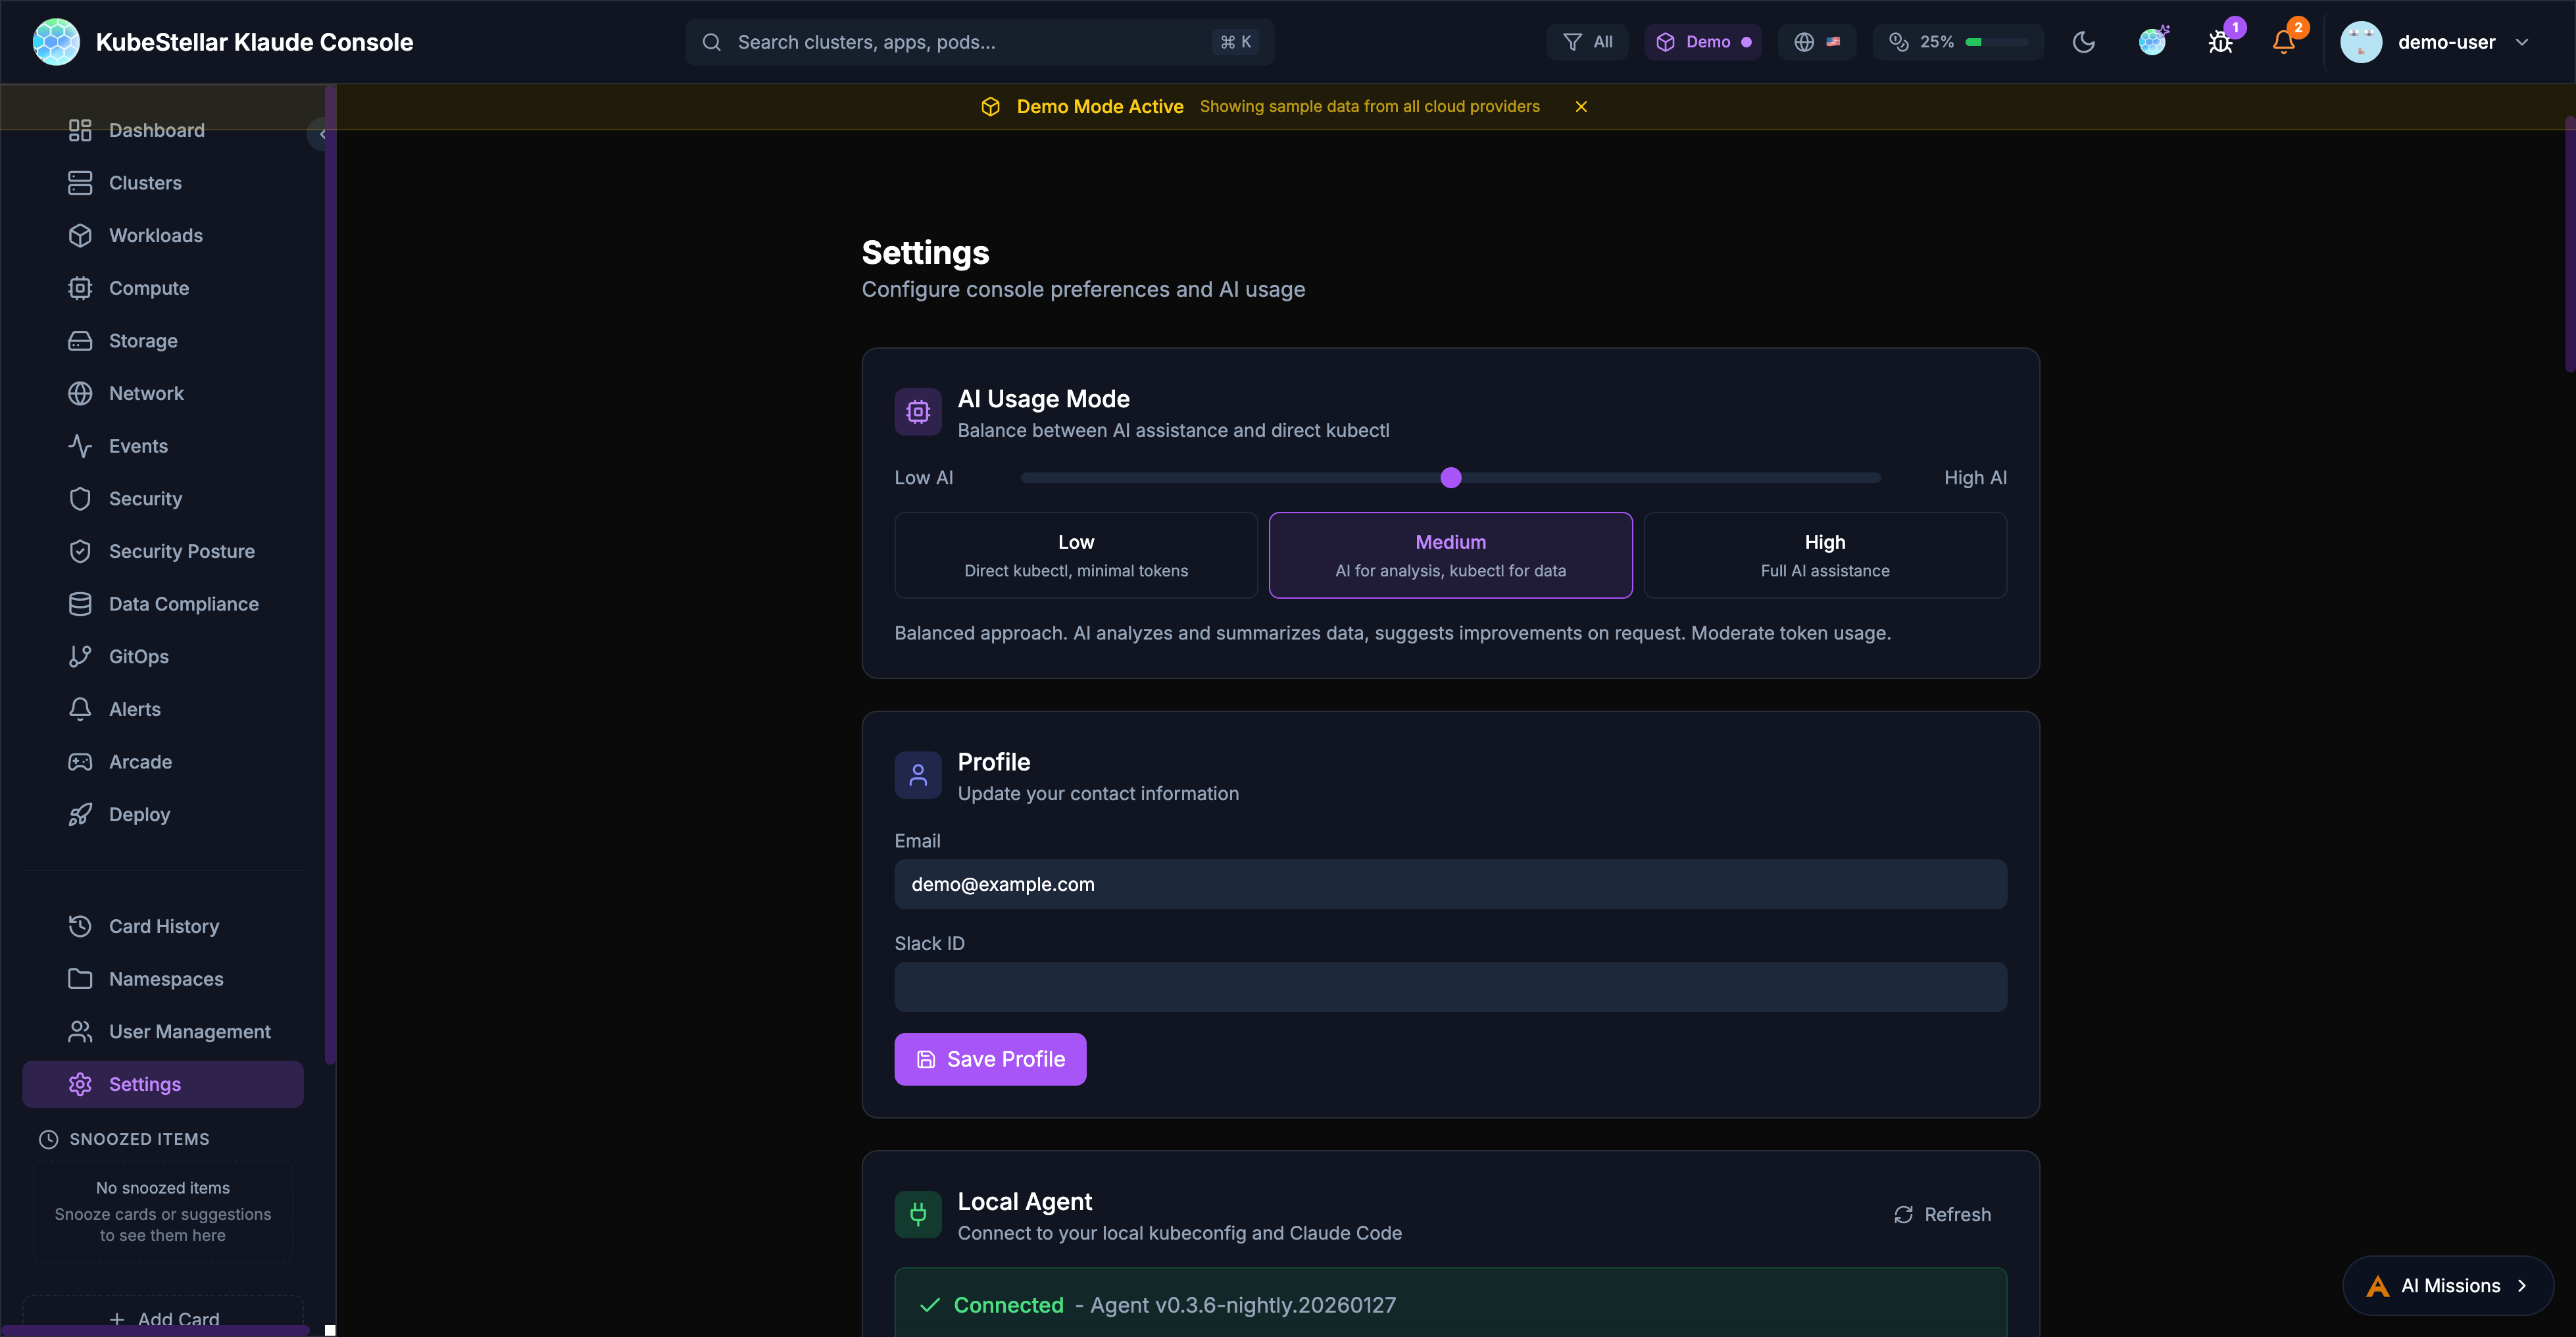
AI Usage Mode
Control how much AI assistance you receive:
- Low: Direct kubectl commands, minimal token usage
- Medium: AI for analysis and suggestions
- High: Full AI assistance for all operations
Local Agent
Connect to your local kubeconfig and Claude Code:
- View agent version and connection status
- See connected clusters
- Monitor token usage (session, daily, monthly)
Update Channels
Choose your release channel:
- Stable (Weekly): Tested releases every week
- Nightly: Latest features, updated daily
Appearance
Customize the look and feel:
- Multiple themes: KubeStellar, Batman, Dracula, Nord, Tokyo Night, Cyberpunk, Matrix
- Visual effects: star field, glow effects, gradients
- Accessibility: color blind mode, reduce motion, high contrast
Token Usage
Monitor and limit AI token consumption:
- Set monthly token limits
- Configure warning and critical thresholds
- Reset usage counters
Navigation
The sidebar provides access to all major sections:
Primary Navigation
- Dashboard: Main multi-cluster overview
- Clusters: Detailed cluster management
- Workloads: Deployments, pods, and jobs
- Compute: CPU, memory, and GPU resources
- Storage: Persistent volumes and claims
- Network: Services, ingresses, and network policies
- Events: Kubernetes event stream
- Security: Security posture and alerts
- GitOps: Helm, Kustomize, and ArgoCD
Secondary Navigation
- Card History: Previously viewed cards
- Namespaces: Namespace-specific views
- User Management: RBAC and access control
- Settings: Console configuration
Special Sections
- Arcade: Games and entertainment
- Deploy: Multi-cluster deployment tools
Search
The global search bar (Cmd/Ctrl + K) enables quick navigation:
- Search clusters by name
- Find applications and pods
- Navigate to specific namespaces
- Filter by resource type
Alerts
The alert system keeps you informed:
- Real-time notifications for critical events
- Configurable alert rules
- Integration with external notification systems
- Alert history and acknowledgment
AI Missions
AI-powered automation for common tasks:
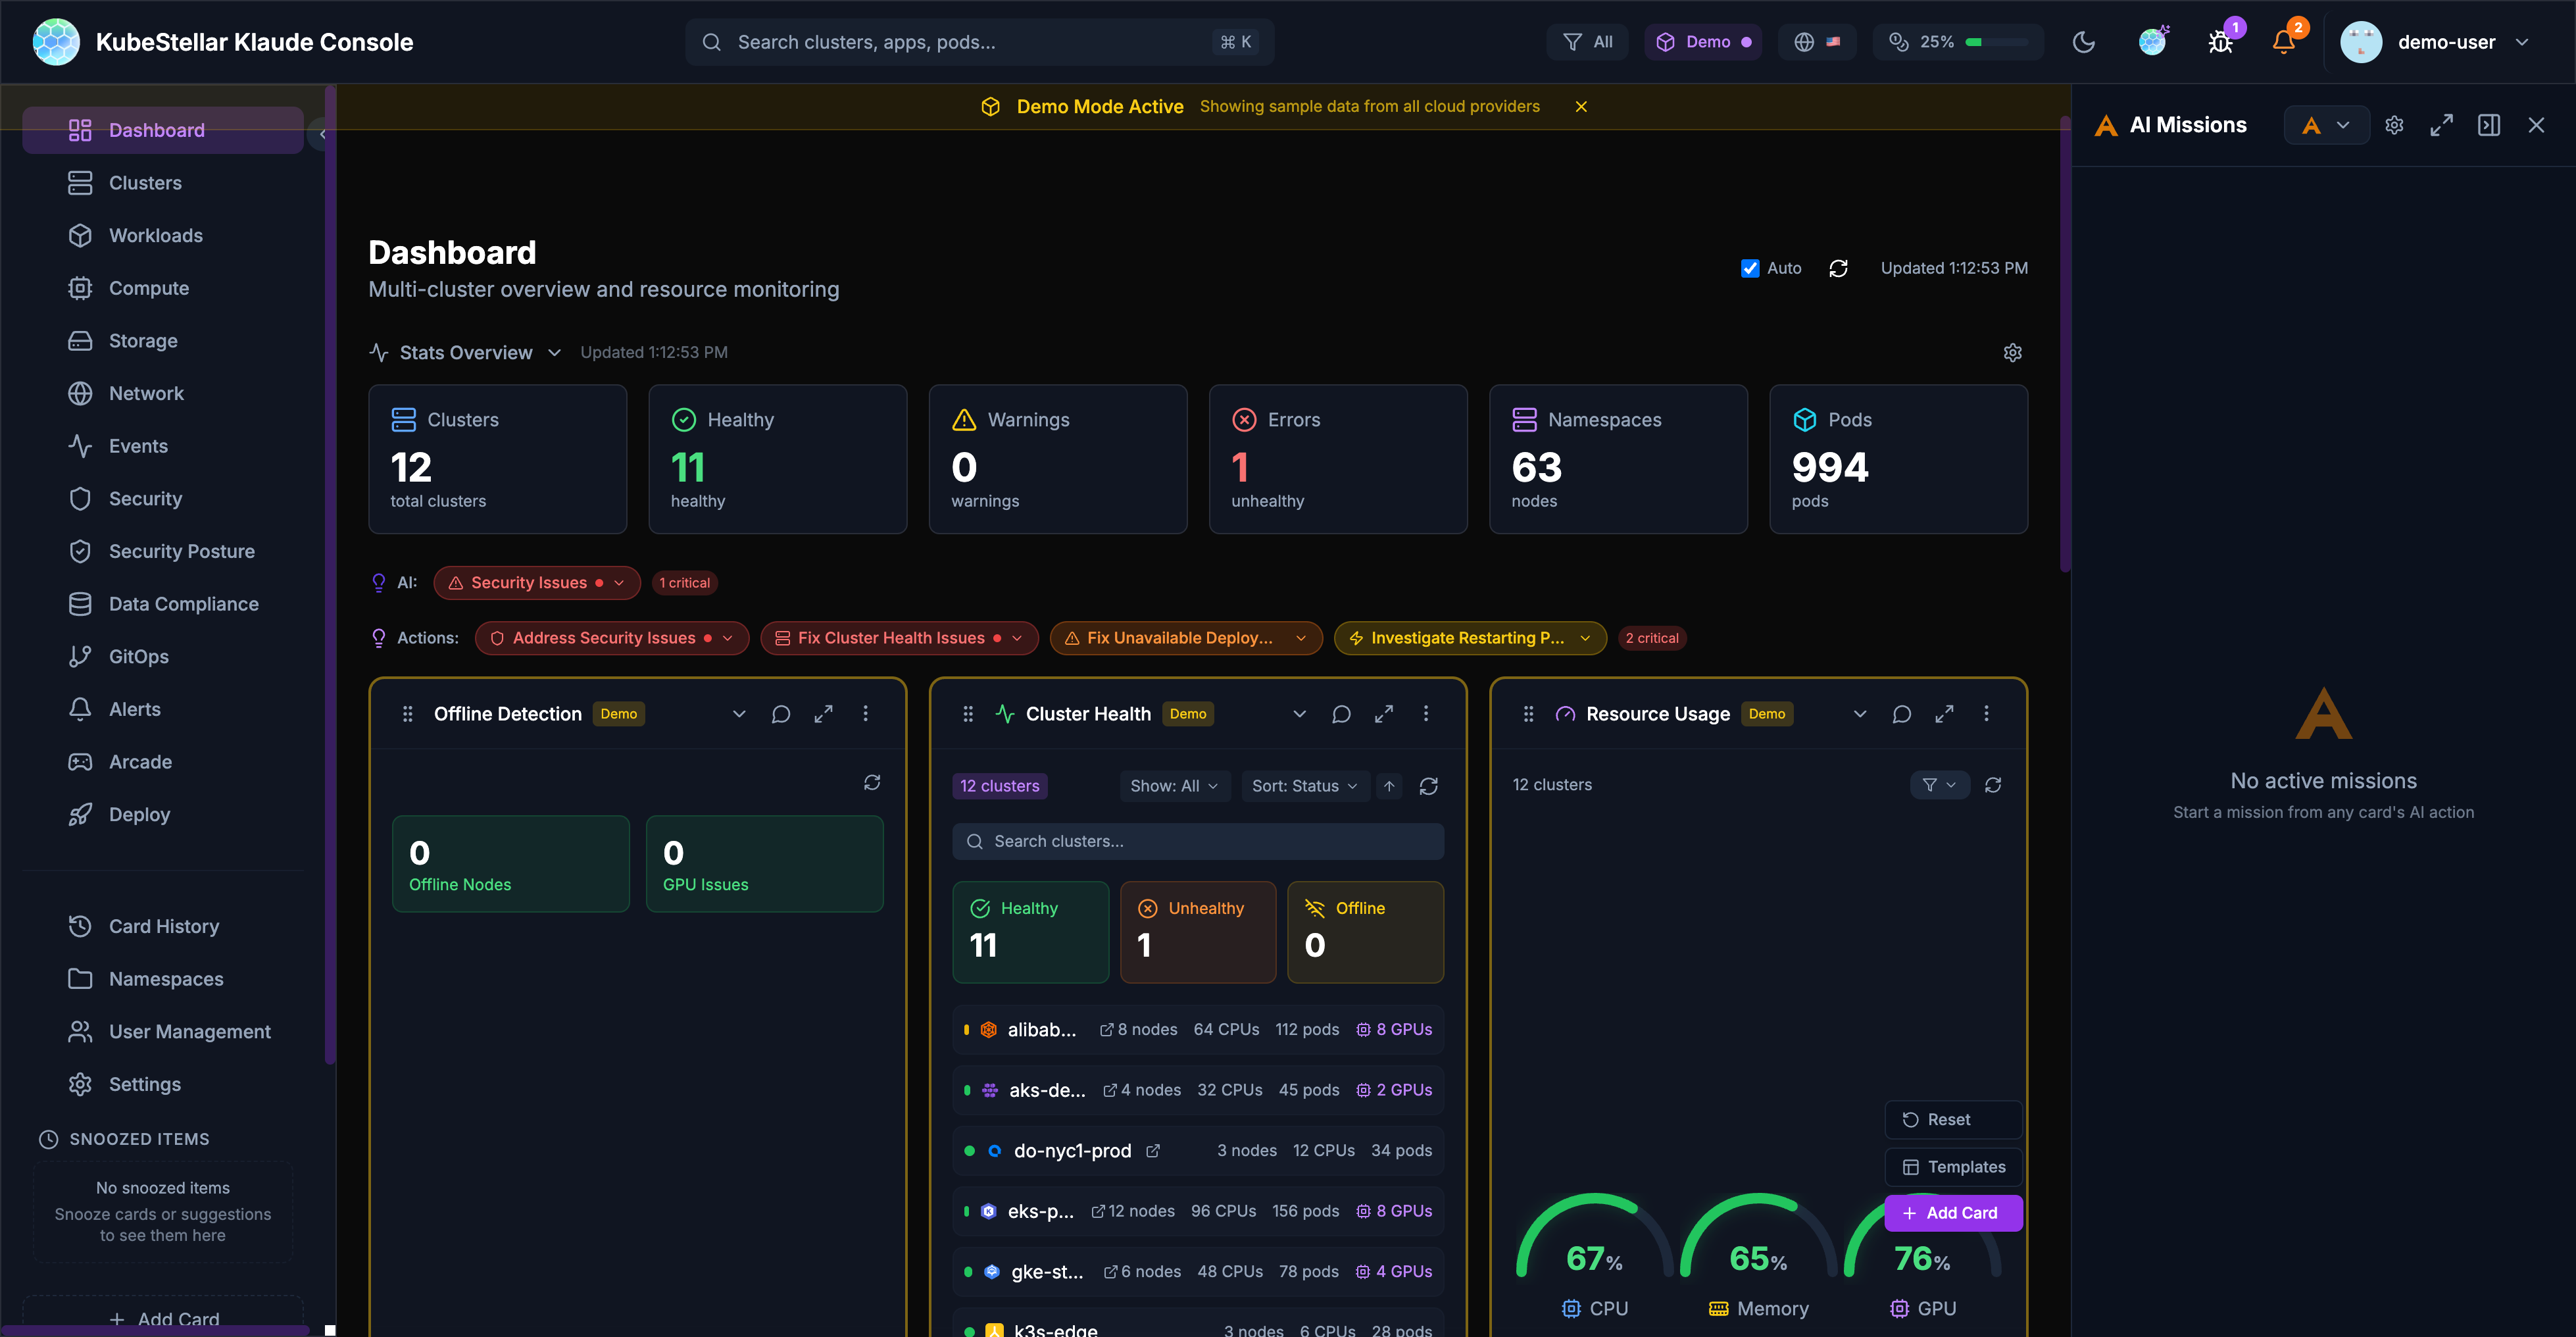
Starting a Mission
Missions can be started from:
- Card AI buttons: Click the AI icon on any card
- Stats bar actions: Click “Address Security Issues” or similar action buttons
- Keyboard shortcut: Press
Mto open the missions panel
Mission Types
- Security Analysis: Investigate security issues and vulnerabilities
- Performance Investigation: Analyze slow pods or resource constraints
- Troubleshooting: Debug failing deployments or pods
- Remediation: Apply fixes for common problems
AI Provider Configuration
The console supports multiple AI backends:
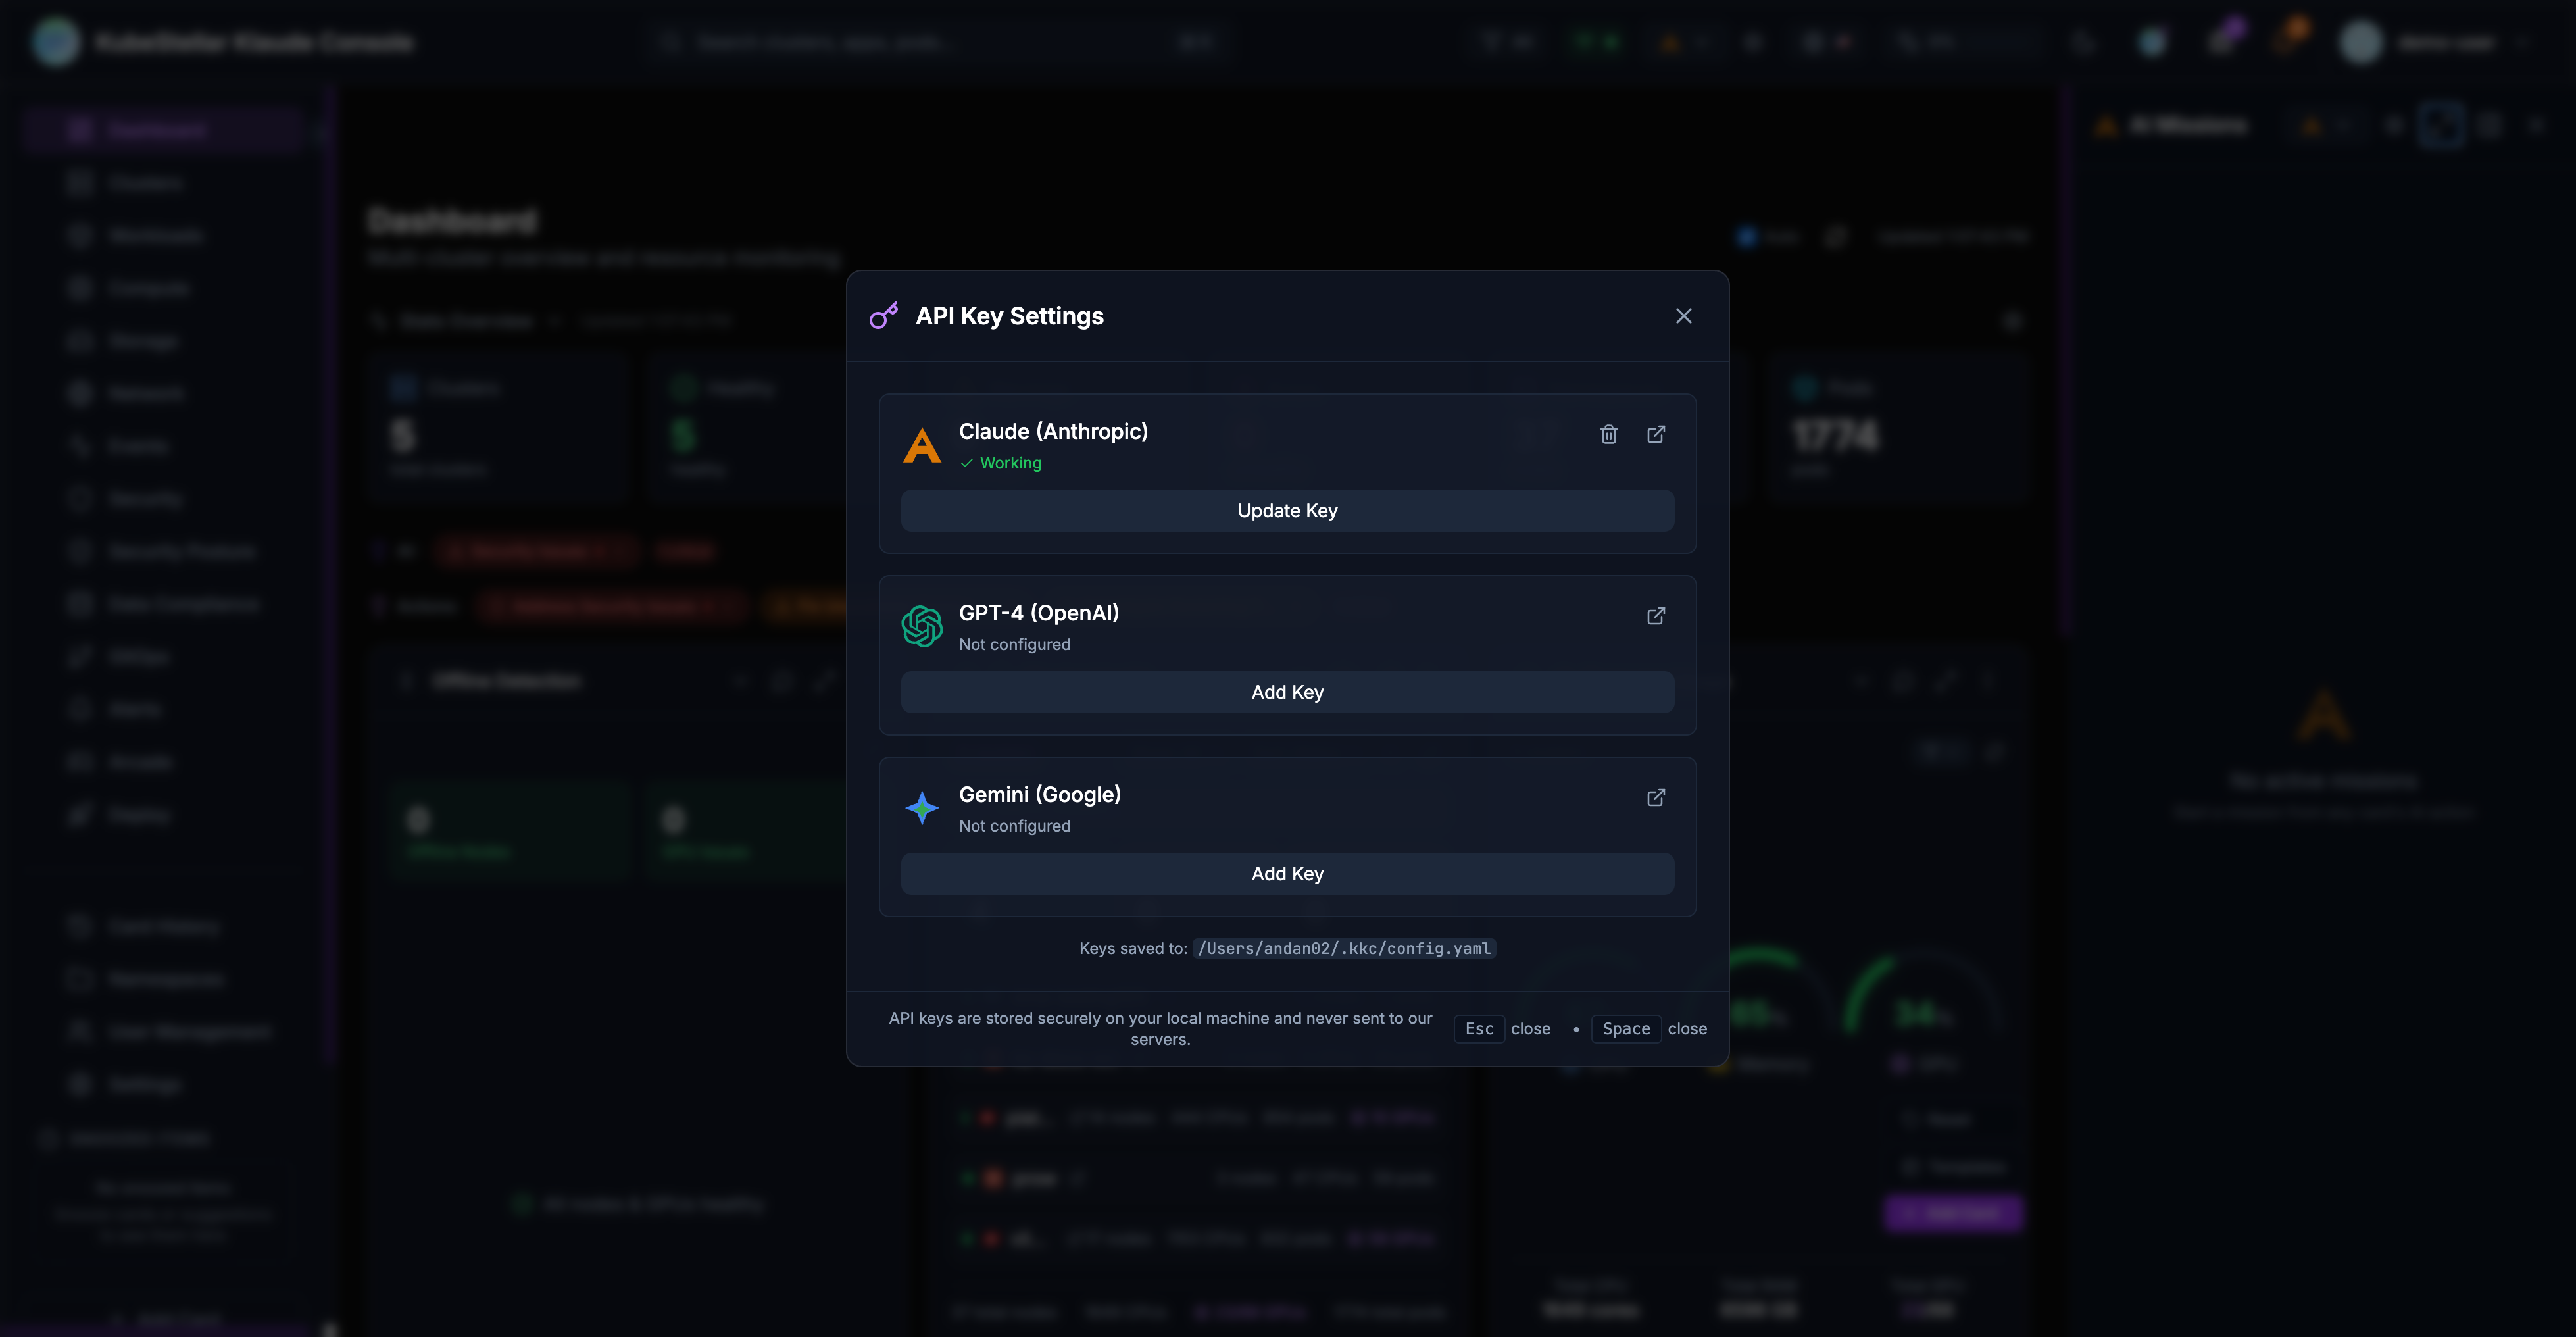
- Claude (Anthropic): Primary AI backend with API access
- Claude Code (Local): Uses your local Claude Code installation for missions
- GPT-4 (OpenAI): Alternative LLM backend
- Gemini (Google): Alternative LLM backend
Configure API keys in Settings > AI Provider Keys or click the key icon in the header.
Offline Detection
The Offline Detection card monitors node and GPU health:
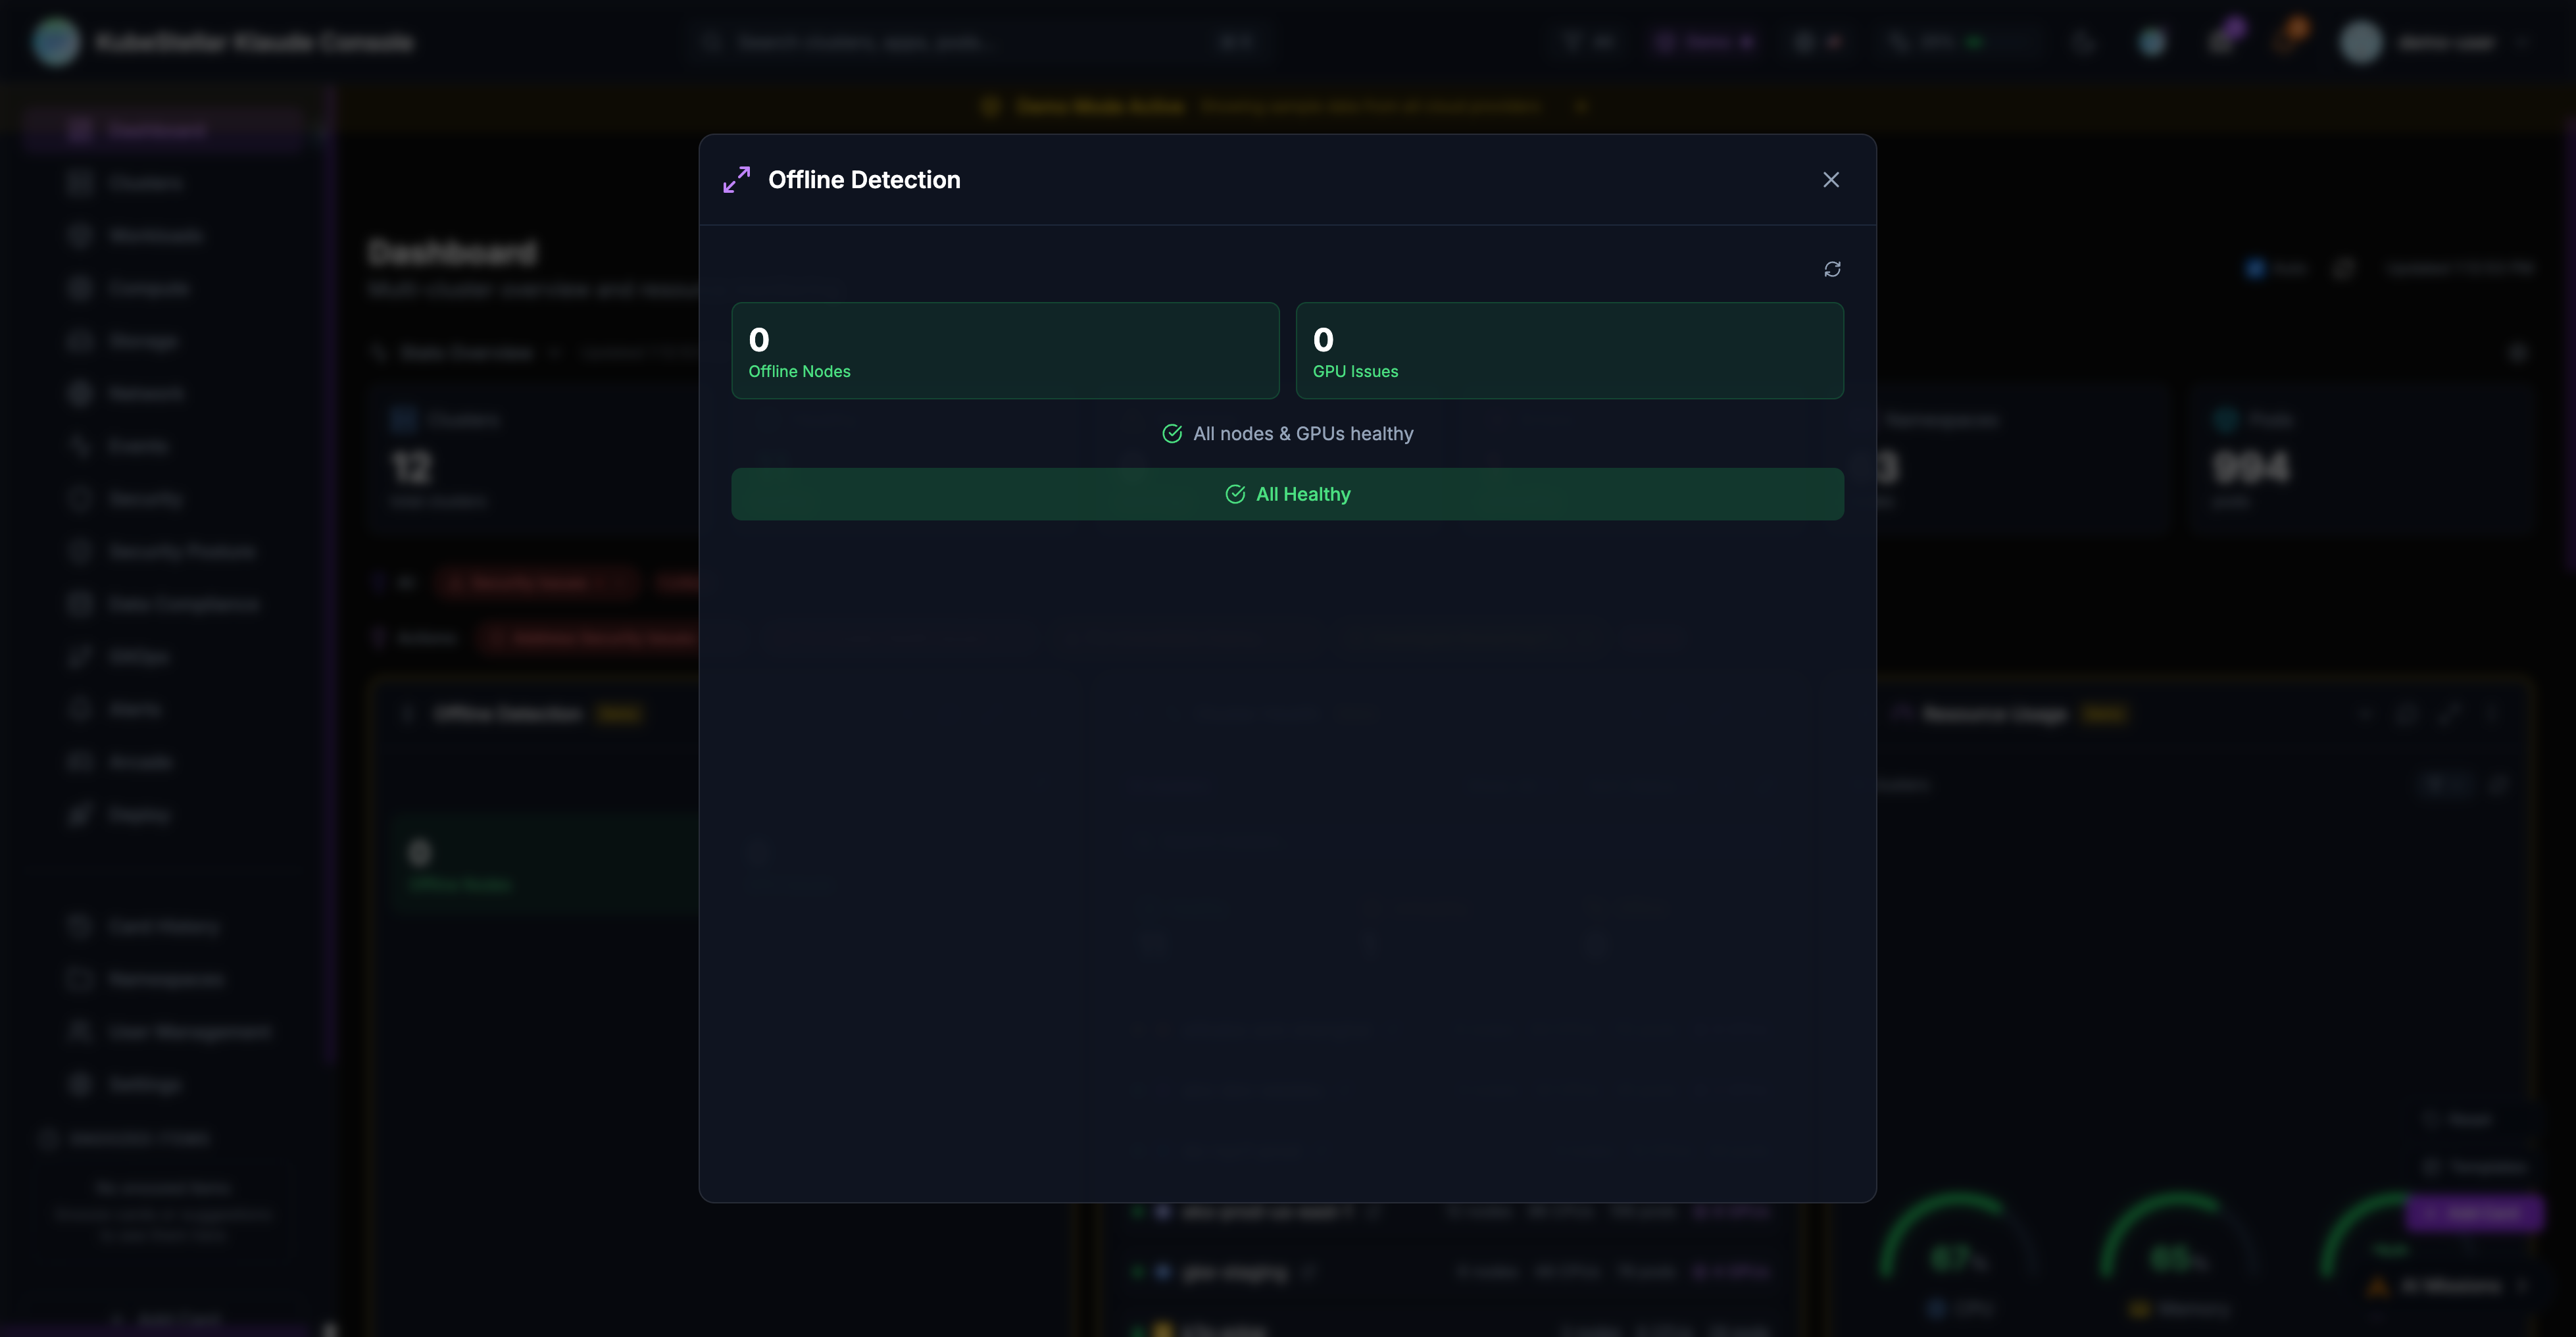
Features
- Node Monitoring: Detects nodes with NotReady status
- GPU Tracking: Identifies GPU nodes reporting 0 available GPUs
- Health Summary: Shows count of offline nodes and GPU issues
- AI Analysis: Click “Analyze Issues” to start an AI mission investigating problems
Status Indicators
- All Healthy: Green status when no issues detected
- Issues Found: Red/orange status with counts of affected resources
- Drill-Down: Click counts to navigate to affected resources
Deploy Page
The Deploy page provides tools for managing deployments across clusters.
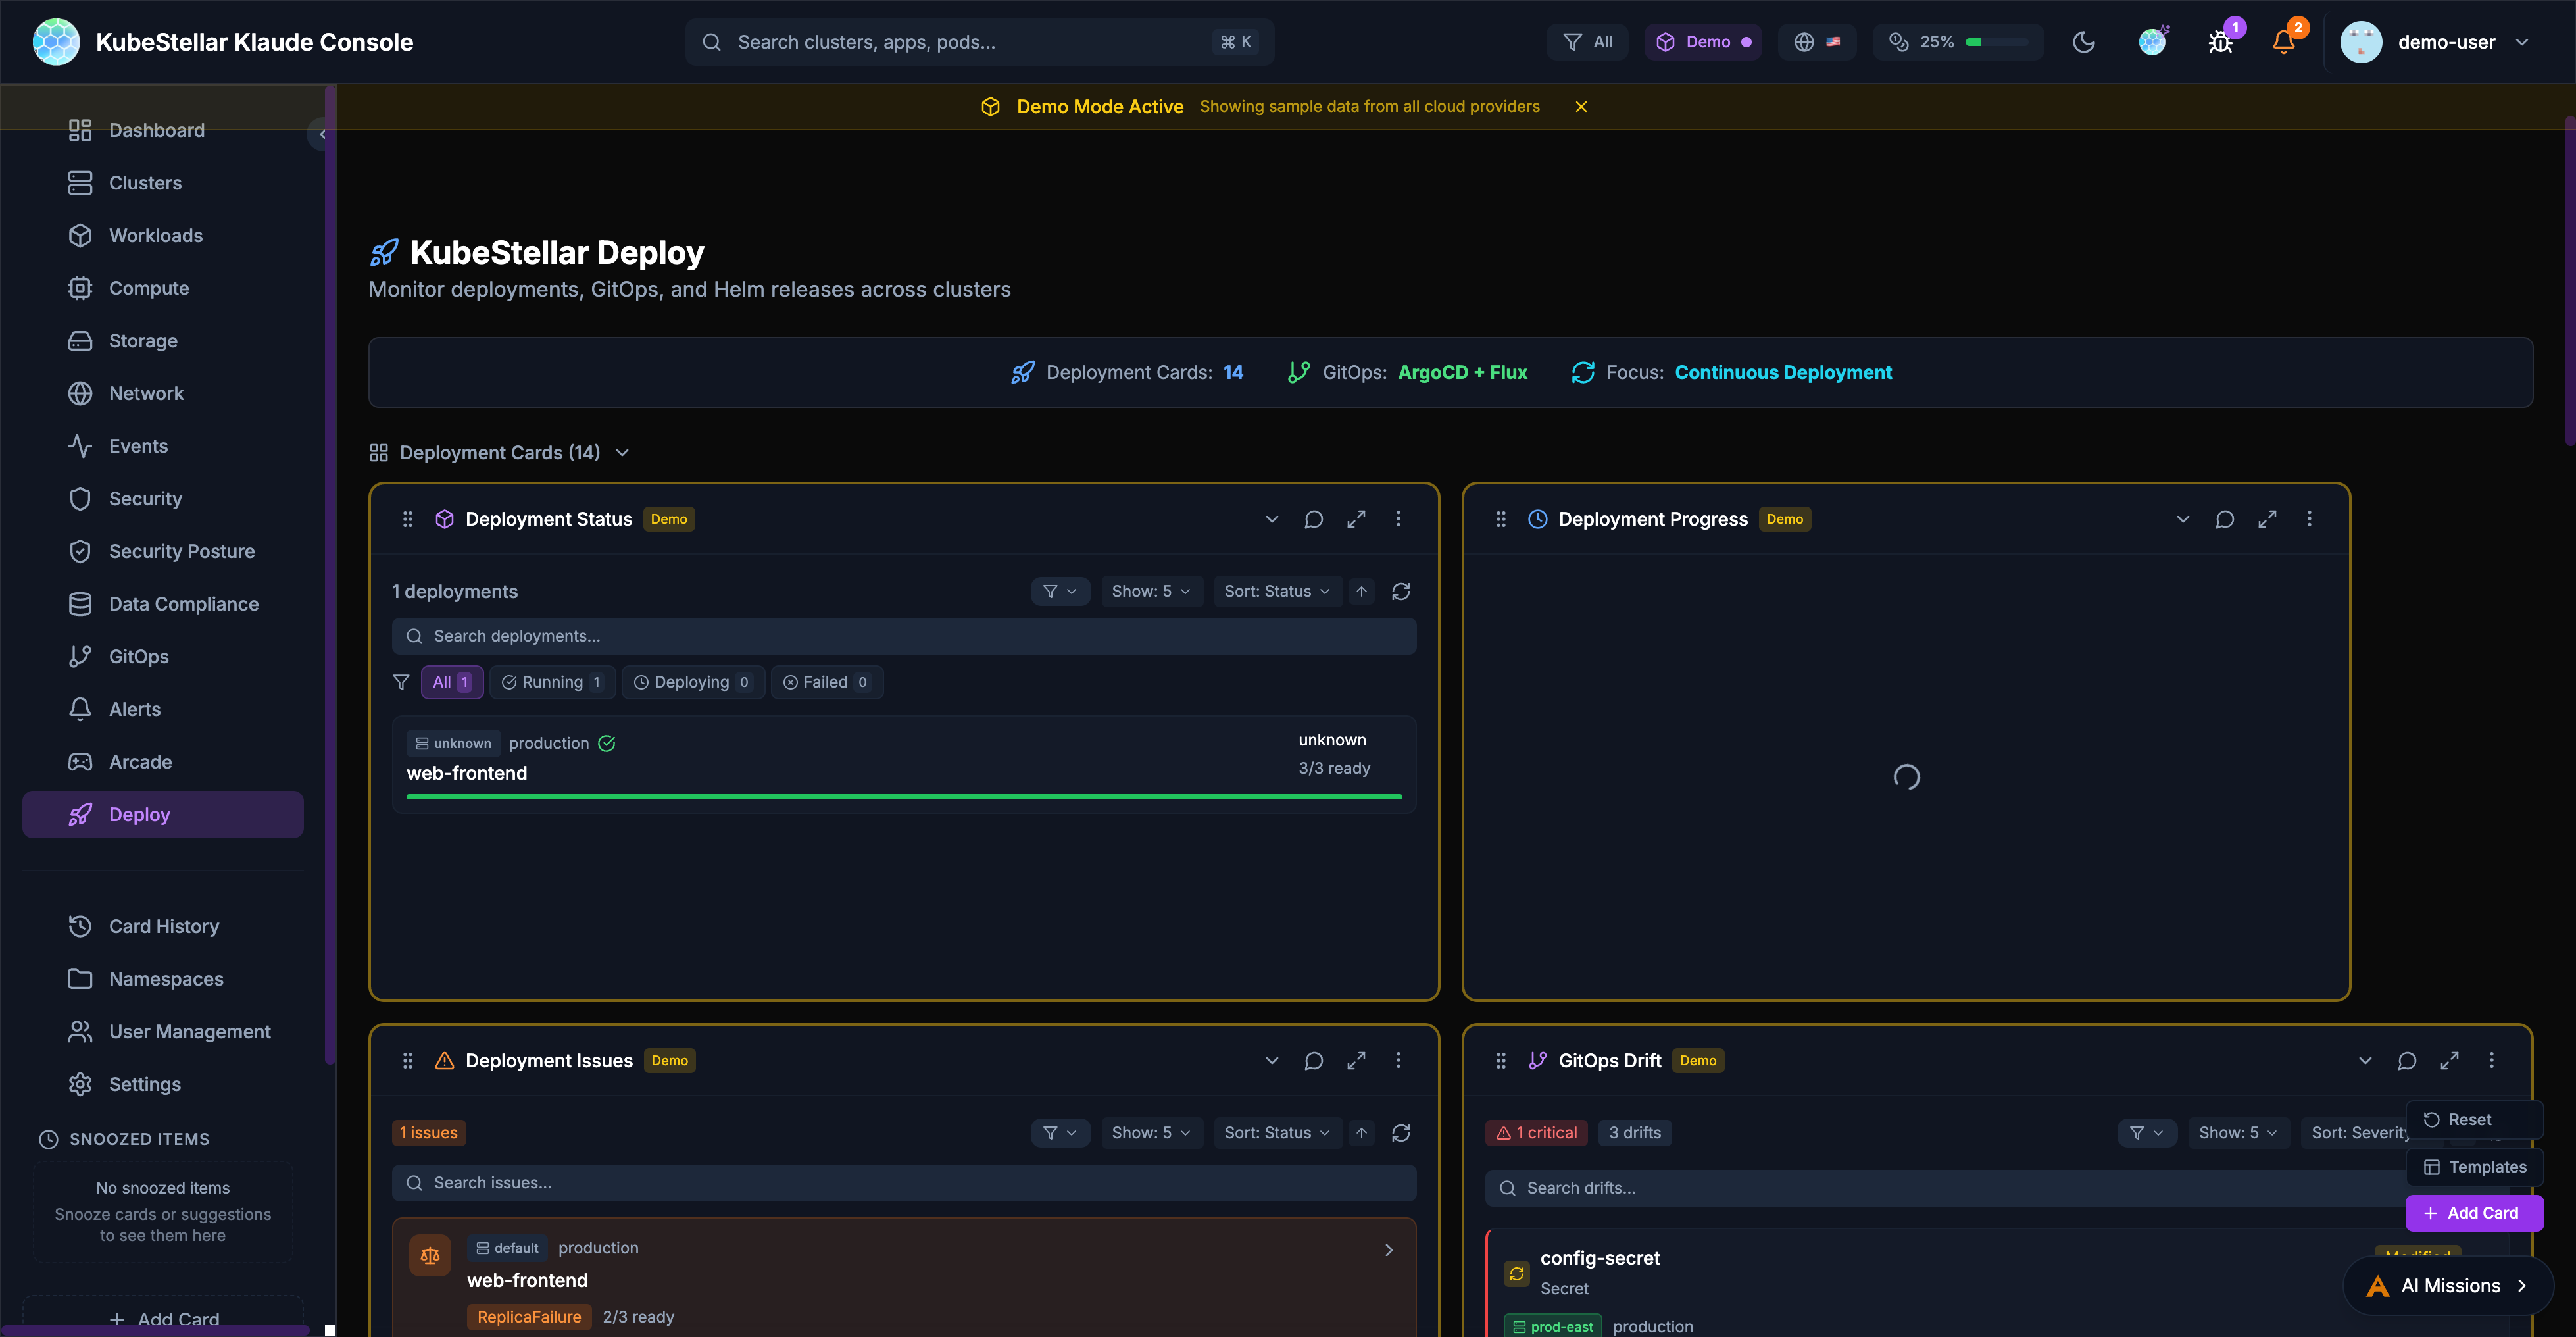
Deployment Cards
- Deployment Status: Overview of all deployments
- Deployment Progress: Track rollout progress
- Deployment Issues: View failing deployments
GitOps Integration
- GitOps Drift: Detect configuration drift from Git
- ArgoCD Applications: Manage ArgoCD apps across clusters
- ArgoCD Sync Status: Monitor sync state
- ArgoCD Health: Application health dashboard
Helm Management
- Helm Release Status: View deployed releases
- Helm History: Track release revisions
- Helm Chart Versions: Monitor chart updates
Kustomize
- Kustomization Status: Monitor Flux kustomizations
- Overlay Comparison: Compare environment overlays
Workload Deployment
Deploy workloads across clusters with drag-and-drop:
- Select a workload type (Deployment, StatefulSet, Job)
- Drag to target clusters on the world map
- Configure namespace and replicas
- Preview changes before applying