KubeStellar Klaude Console
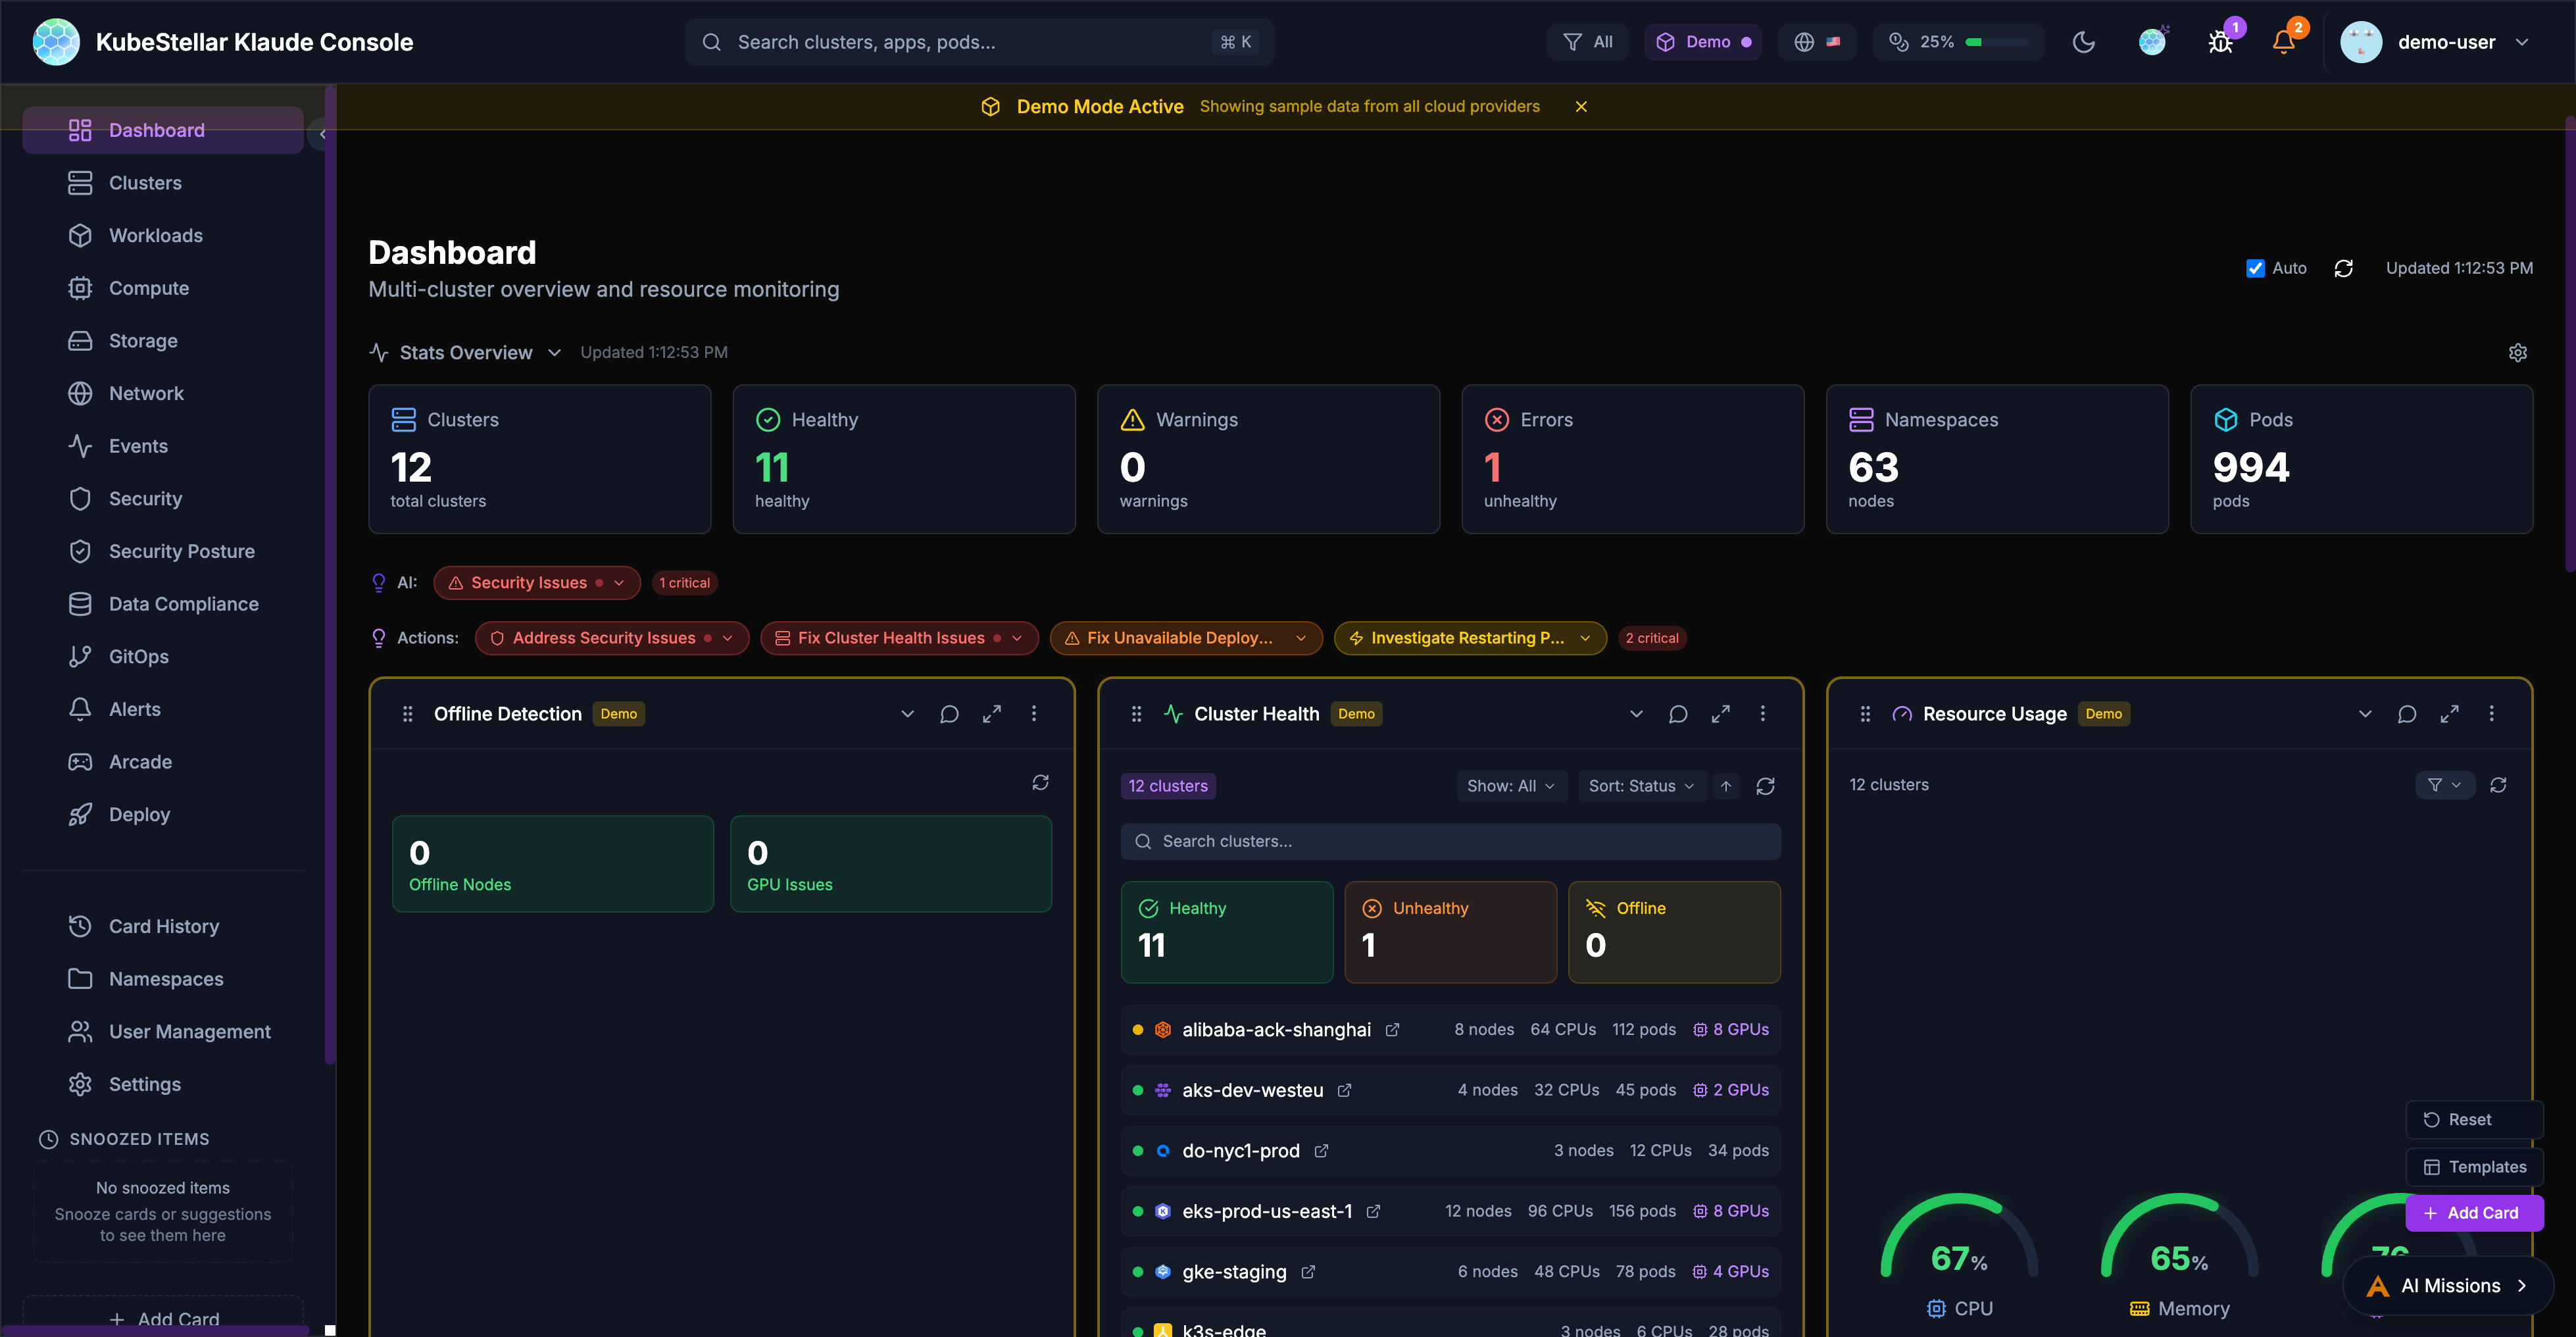
The KubeStellar Klaude Console is a modern, AI-powered multi-cluster management interface that provides real-time monitoring, intelligent insights, and a customizable dashboard experience for managing Kubernetes clusters at scale.
Key Features
Multi-Cluster Management
- Monitor and manage multiple Kubernetes clusters from a single dashboard
- Support for various cluster types: OpenShift, OKE, EKS, GKE, AKS, kind, and more
- Unified view of cluster health, resources, and workloads across all clusters
AI-Powered Insights
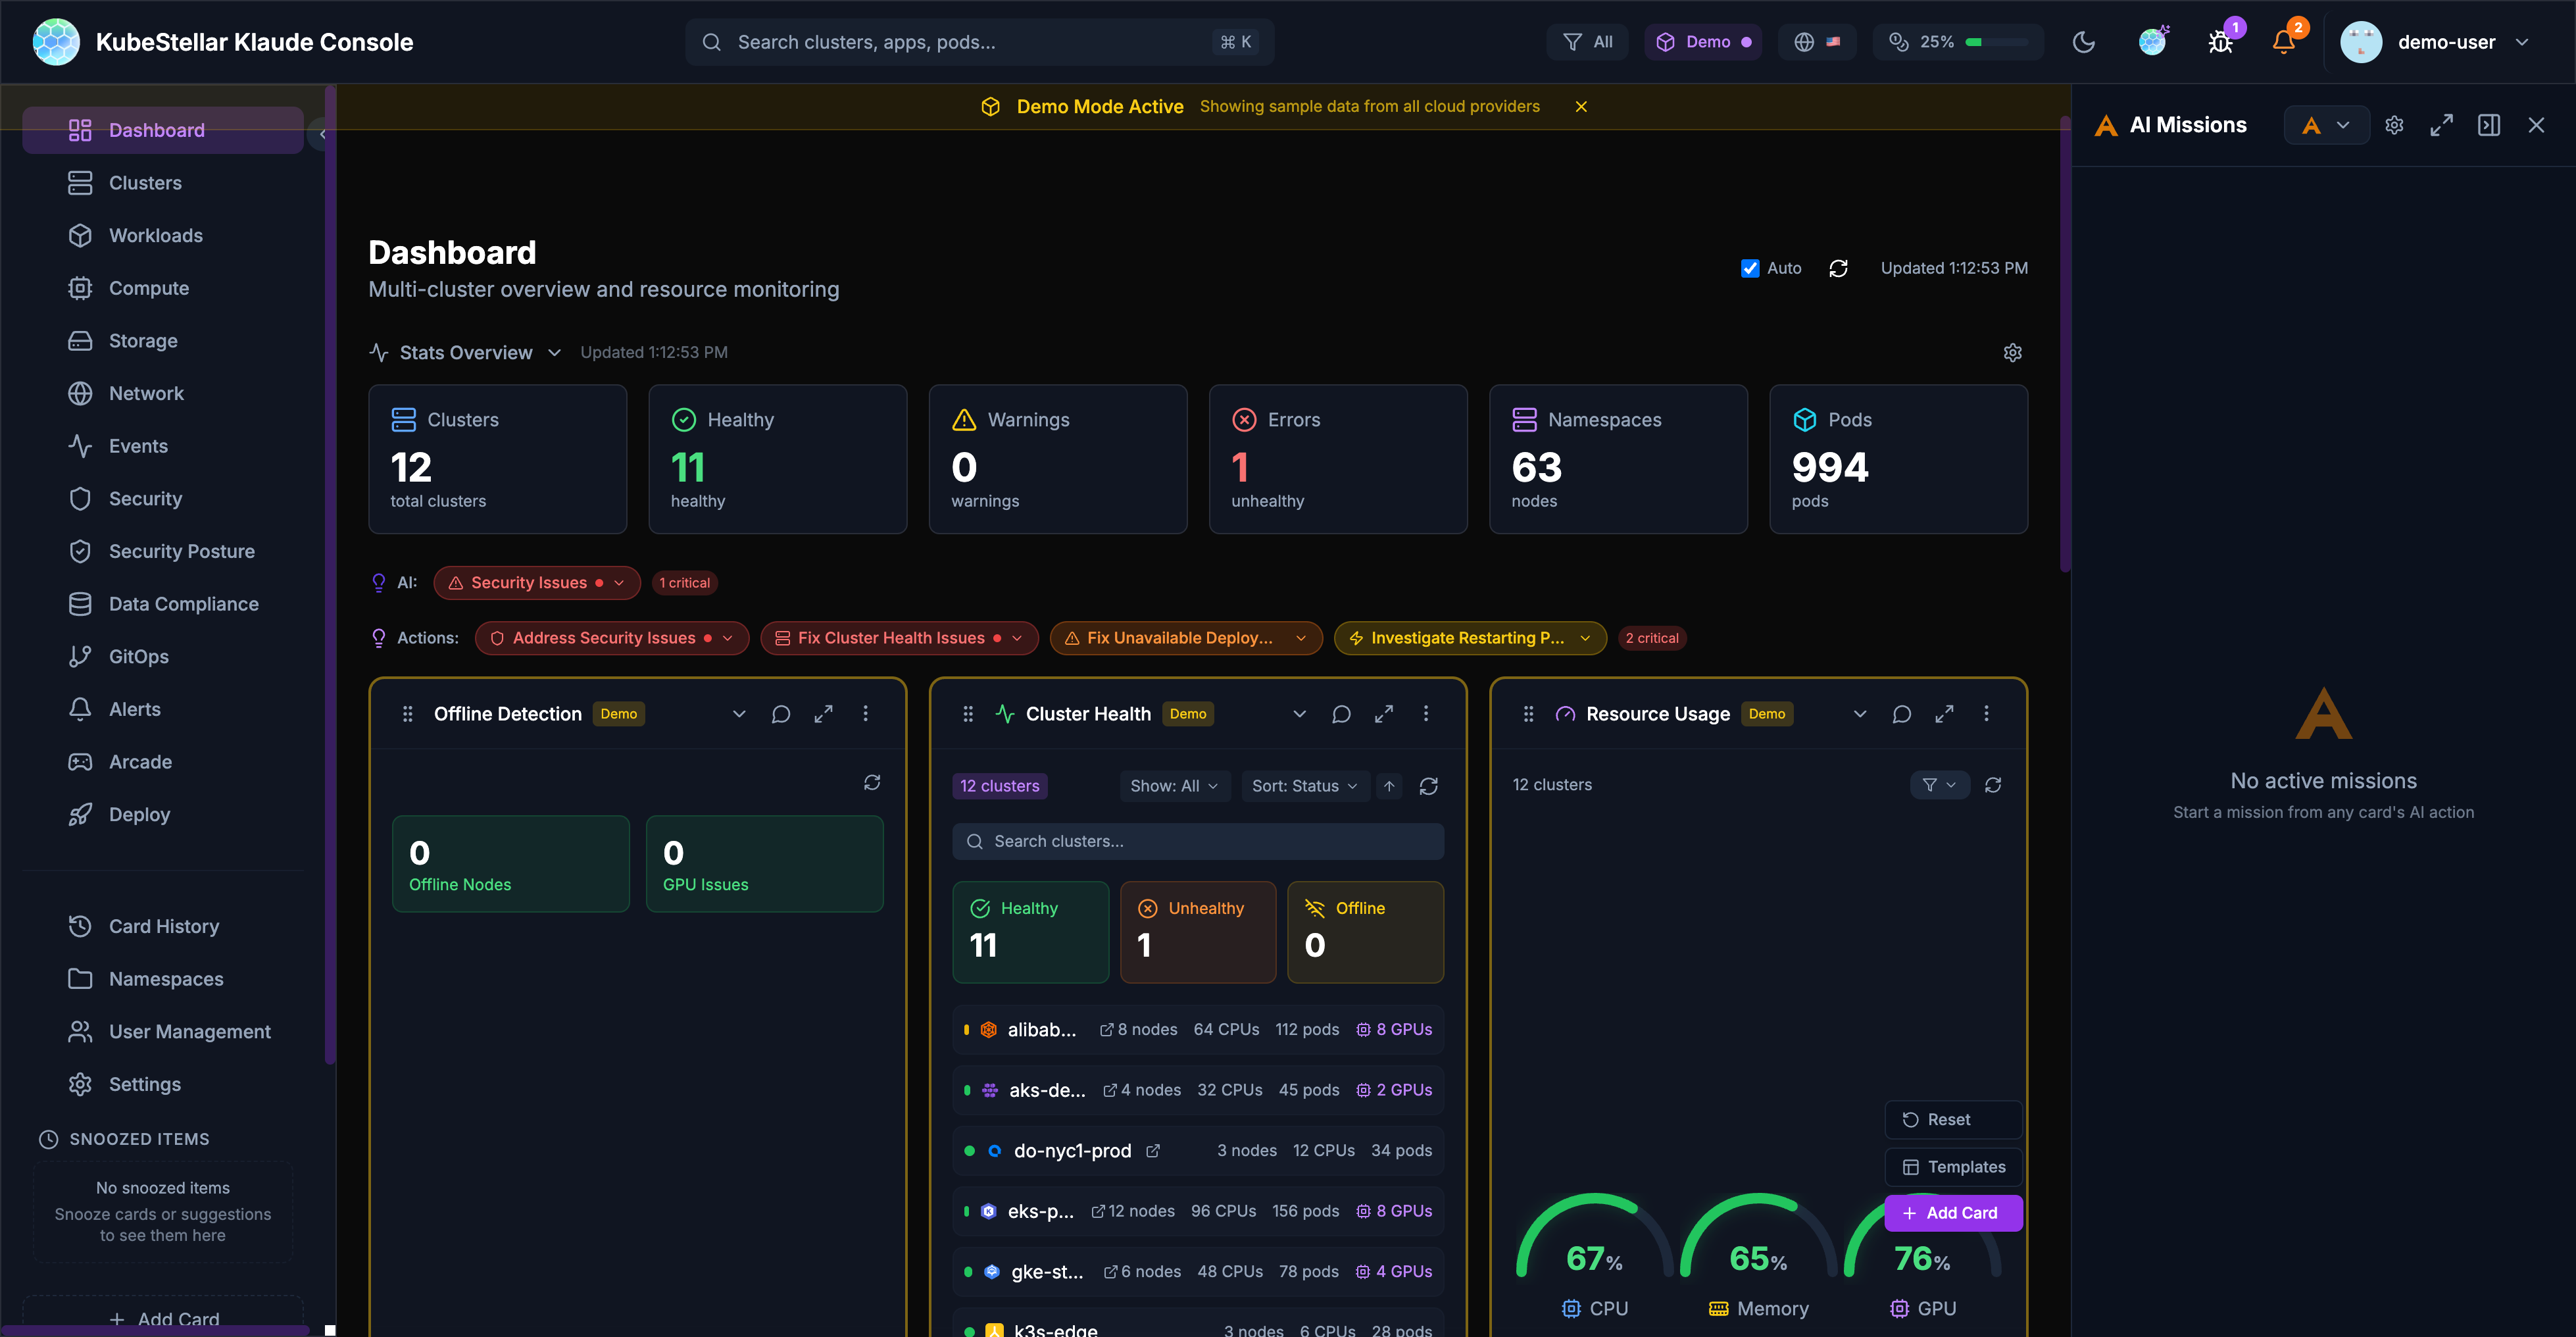
- AI missions for automated issue detection and remediation
- Intelligent recommendations for cluster optimization
- Natural language queries about cluster state and resources
Customizable Dashboards
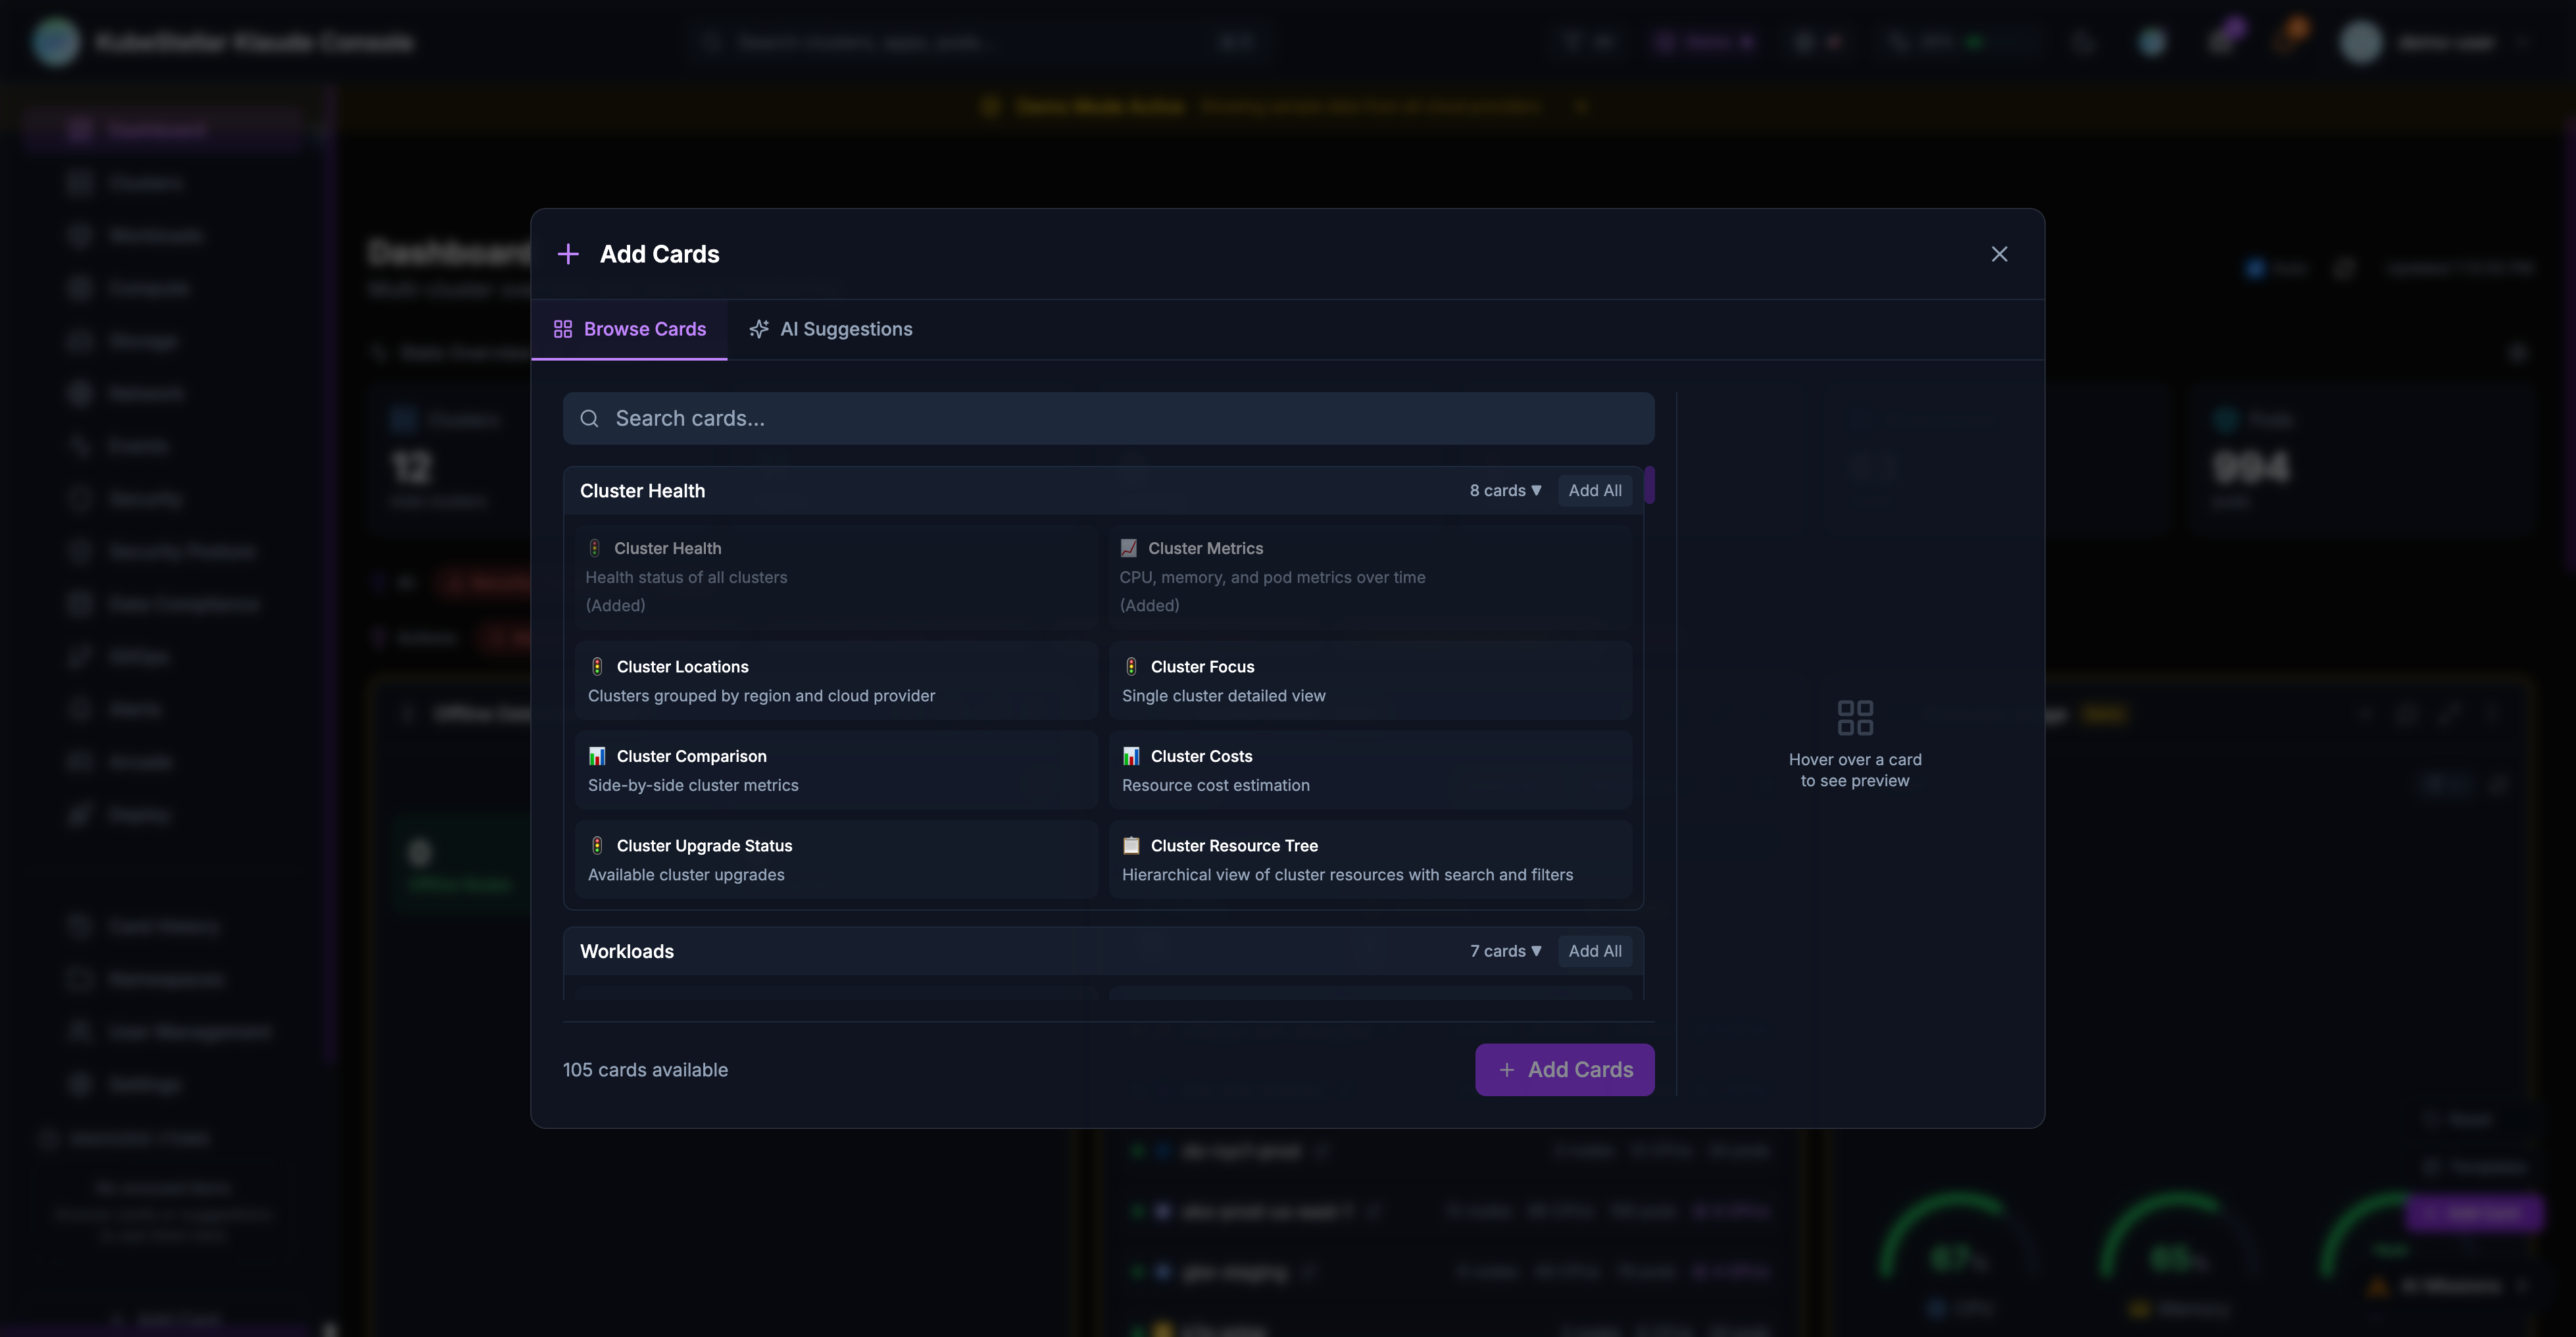
- 100+ dashboard cards for different monitoring needs
- Drag-and-drop card arrangement
- Dashboard templates for quick setup
- Configurable stat blocks for at-a-glance metrics
Real-Time Monitoring
- Live cluster metrics with historical charts
- Event streaming across clusters
- GPU monitoring and utilization tracking
- Pod and deployment status tracking
Getting Started
Demo Mode
The Klaude Console includes a demo mode that showcases all features with simulated data. To run in demo mode:
cd web
VITE_DEMO_MODE=true npm run dev -- --port 5174
Navigate to http://localhost:5174 to explore the console with demo data.
Production Setup
For production use, the console requires:
- KKC Agent: A local agent that connects to your kubeconfig
- Backend API: The KKC API server running on port 8080
See the installation guide for detailed setup instructions.
Architecture
The Klaude Console consists of:
- Frontend: React + TypeScript + Vite application
- KKC Agent: Go-based agent that interfaces with Kubernetes clusters
- Backend API: REST API for data aggregation and AI features
Documentation
- Features Guide - Detailed feature documentation
- Card Reference - Complete list of available cards
- Rewards System - Community engagement and rewards
- Updates - Release channels and version management
Community
Join the KubeStellar community: